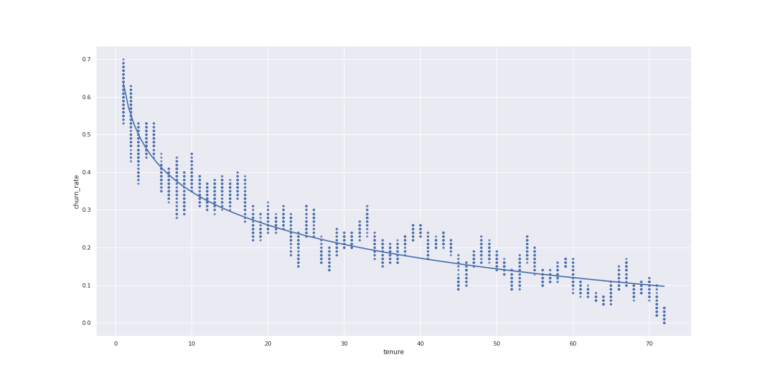
Read about the findings!
Go to Report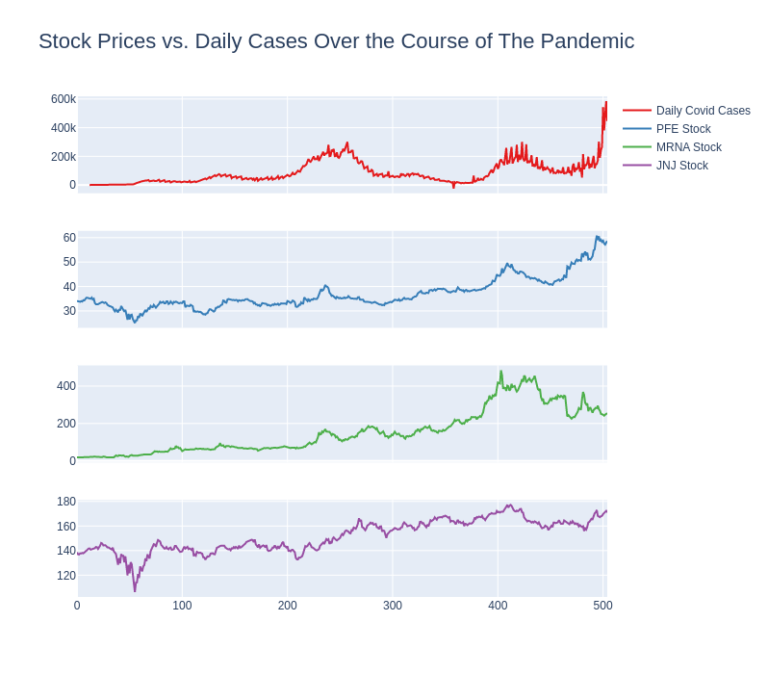
Read about the findings!
Go to Report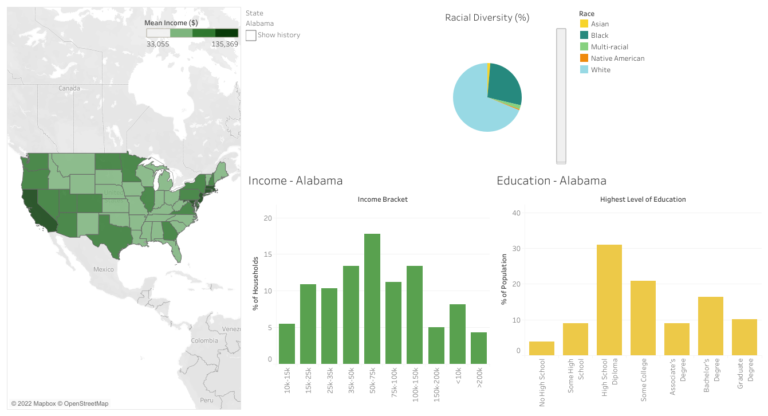
See this highly interactive visual in action!
Try it Out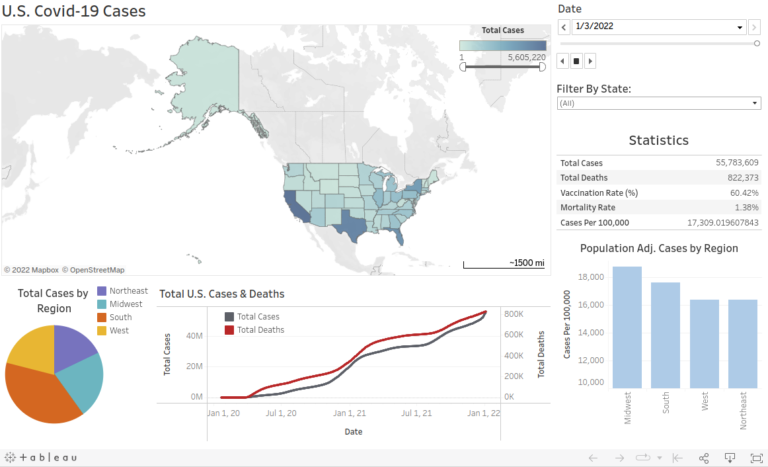
See this highly interactive visual in action!
Try it Out
See this interactive visual in action!
Try it Out