Project Overview
Understanding your customer base is an integral part of any business. One method to aid this goal is analyzing customer churn and identifying key characteristics impacting whether a customer will continue buying from the company. This analysis can be used to drive customer-focused business insights and decisions. In this report, we take a surface-level look into the customer churn of the global telecommunications company Telco. The data is made up of 7043 customers and includes 21 features measuring things like account information, demographics, and services used. The goal of the project is to identify and visualize some key characteristics that drive churn. This information could be used to take a deeper dive into the specific areas identified or to develop predictive models.
Key Findings
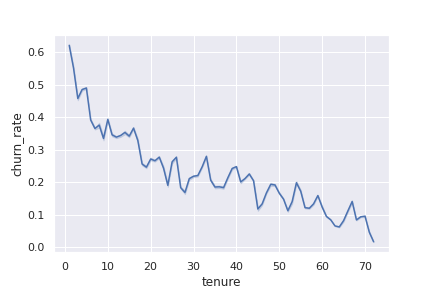
- The feature found to have the most correlation with churn rate was customer tenure. The graph to the right illustrates the churn rates at each month of customer tenure. There is a clear visual negative trend indicating that, somewhat unsurprisingly, the longer customers stay with the company, the lower the churn rates.
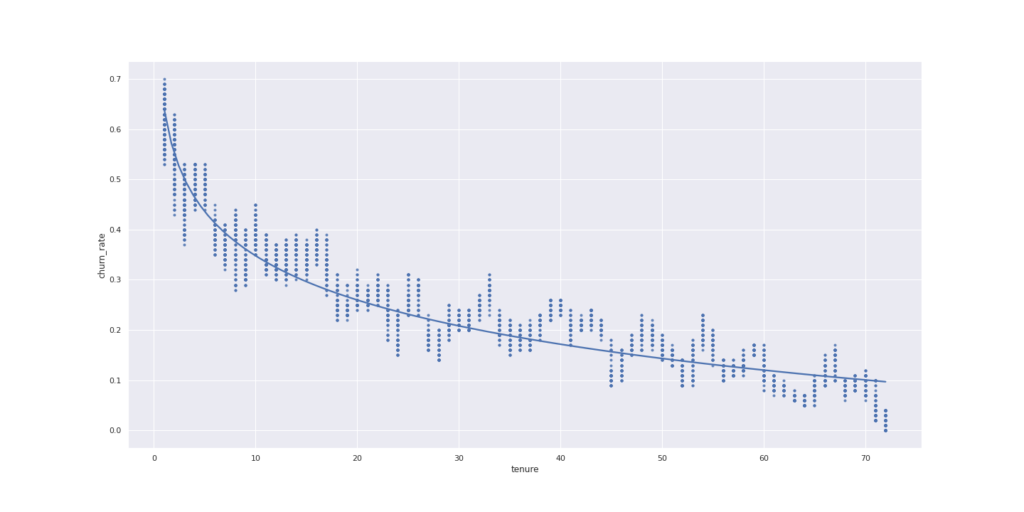
- More interestingly, however, the relationship between tenure and churn rate fits almost perfectly (r2= .999) to a logarithmic model. This indicates that churn is a huge potential issue in the first few months of gaining a customer, however after this initial period churn rates stabilize and tenure becomes of minimal importance.
- This idea is further illustrated when looking at the distribution of those customers who have left. 40% of these customers left within the first 4-5 months of signing up. This time period is most critical to retain customers.
- Along the same vein, longer lengths of contracts also decrease churn rates significantly. Despite the lack of data points, I would speculate that this has a somewhat similar relationship to the logarithmic relationship that tenure has with churn rates.
- Though phone services did not seem to have a meaningful relationship with churn, Internet services definitely did. We see almost double the churn rate for customers who have fiber optic internet through Telco than for customers who have DSL internet. Answering why would require more data and analysis, though possible influences could be things like a higher expectations of service, price, etc.
- Some additional services also had notable relationships with churn. Supportive services like tech support and online security have the most impact on churn. Customers who have these services were 3 times less likely to leave the company. Though less dramatic, protective services (i.e. device protection, online backup) also had an impact on churn rates, with subscribing customers about 2 times less likely to leave. Streaming services did not seem to have much impact on churn.
- Finally, There are a couple demographic differences worth mentioning. The churn rate of senior citizens was almost double that of those who weren’t. We also see churn rates decrease if customers have either a romantic partner or dependents. Customers who are a part of a family (partner+dependents) were 2.4 times more loyal than customers who were single with no dependents.
Areas to Research Further
Monthly charges have an interesting relationship with churn. As seen in the chart below, churn rates spike at precise levels of monthly charges. This could indicate that increases in the services used by the customer affects churn. It could also indicate that specific add-ons/services have a significant impact on churn.
About the Programming and Analysis
- After transferring the data to Jupyter Lab, it was cleaned and formatted using Pandas. A few subsets of the data were created based on field attributes for easier reference later.
- Data exploration began by calculating churn rates based on each field containing categorical data
- ‘Impact’ metrics were calculated for each field. This measured the difference in churn rates of the categories in the field. This helped to get an idea of which fields influenced churn most
- I then began analyzing the continuous variables (tenure and monthly charges.) After plotting the average churn against tenure using the seaborn library, I noticed a distinct relationship. Upon further inspection, I saw that the relationship between the fields looked almost logistic. I did some regression analysis using logistic regression and the scipy library. I found that my model accounted for essentially all of the data.
- Using the plotly express library, I made some appealing and interactive charts to create a better user experience.