Project Overview
Over the course of the Covid-19 pandemic, we’ve seen the U.S. stock market do better and better. This led some people to believe that some companies, specifically in the pharmaceutical sector, are intentionally attempting to elongate the pandemic to improve their stock values. As silly as this conspiracy may be, it brings up an interesting question: Just how much are pharmaceutical companies benefitting from the pandemic?
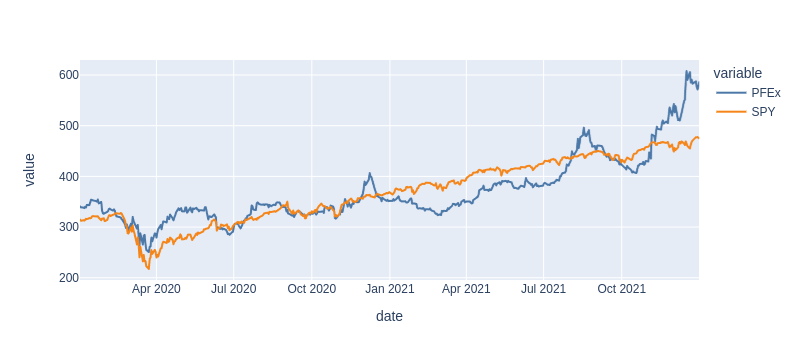
In this project, we take a surface level look at stock prices compared to covid-19 cases. Three main U.S. companies who have produced vaccines were analyzed (Pfizer, Moderna, and Johnson & Johnson). We also look at the S&P 500 index as a baseline measure of the economy. The goal is to find out whether these stock prices are correlated with Covid cases and by just how much.
Key Findings
When looking at the correlation numbers between stock prices and cumulative cases, we see an extremely high correlation between all 3 pharmaceutical companies’ stocks and total U.S. cases. However, the S&P 500 is even more closely correlated to this measure. This suggests that, thus far, an increase in total cases indicates an increase in the performance of the U.S. economy as a whole. Therefore, in this instance cumulative cases are not a great measure to look at.
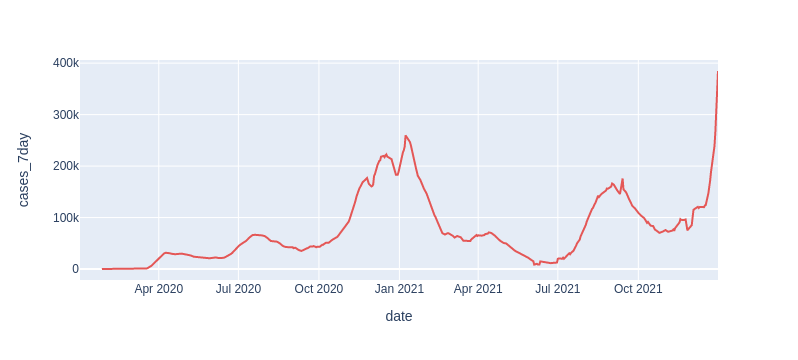
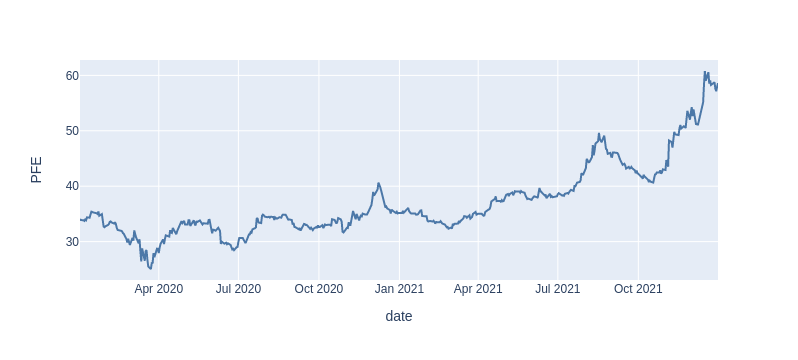
Comparing daily cases led to much more interesting results. Both Moderna as well as Johnson & Johnson saw correlation numbers at or below those of the S&P 500. However, there seems to be a more significant relationship between daily cases and Pfizer. In the graph below, you can see that the shape of the Pfizer stock data looks much closer to that of the daily cases, compared to the other two companies.
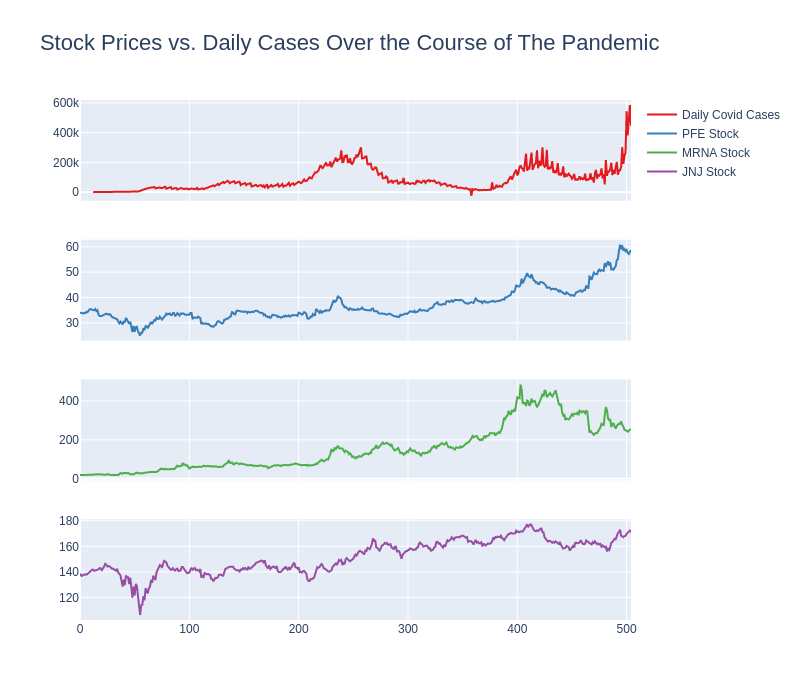
- In fact, whenever there was a spike in covid cases, there seemed to also be a spike in the Pfizer stock.
- There is only really one time period where the direction of PFE stock price doesn’t match that of daily covid cases. This is between ~March, 2021-June, 2021. This difference could be explained by the S&P 500’s steady growth during this time. Pfizer’s stock experienced very similar rates of growth.
- The difference in correlation of Pfizer compared to the other companies could be explained by the dominance that Pfizer has in vaccines sold. The Pfizer vaccine has been administered 50% more times than Moderna, and the Johnson & Johnson numbers don’t come anywhere close to either of them.
Areas to Research Further
Confidently explaining why we see these trends between Pfizer’s stock prices and covid rates would require more in-depth analysis. Some theories of why include: an uptick in vaccine orders when covid cases spike or a general perceived need for more development in medicine during spikes.
About the Programming and Analysis
- The stock data was fetched using the Yahoo! Finance API.
- The data was imported into Jupyter Lab, where it was cleaned and formatted.
- I looked through the correlation matrix to compare stock prices against covid data.
- Seaborn was used to visualize some regressions between cumulative cases.
- Plotly express was then used for the more useful visualizations and subplots.